Execution Statistics
Optional developer feature | Off by default
FreeXmlToolkit can record resource statistics for every technical operation it runs — XSLT transformations, XQuery and XPath evaluations, XSD and Schematron validations, XProc pipelines, and PDF (XSL-FO) rendering. For each run it captures:
- Wall-clock duration and — where measurable — a phase breakdown (XSLT: compile vs. transform; validation: XSD vs. Schematron stage),
- CPU time of the executing thread,
- Heap usage before the run and the heap delta it caused,
- GC activity (collections and GC time observed during the run),
- Input and output sizes,
- success/error state with the error's first line.
This is aimed at technical users: inside the desktop app it rarely matters how long a transformation takes — but when the same stylesheets, queries or validation rules are later moved to a server or cloud environment billed by resources (for example mass transformations of large deliveries), these numbers tell you what one work step costs and where optimizing the script pays off.
Enabling
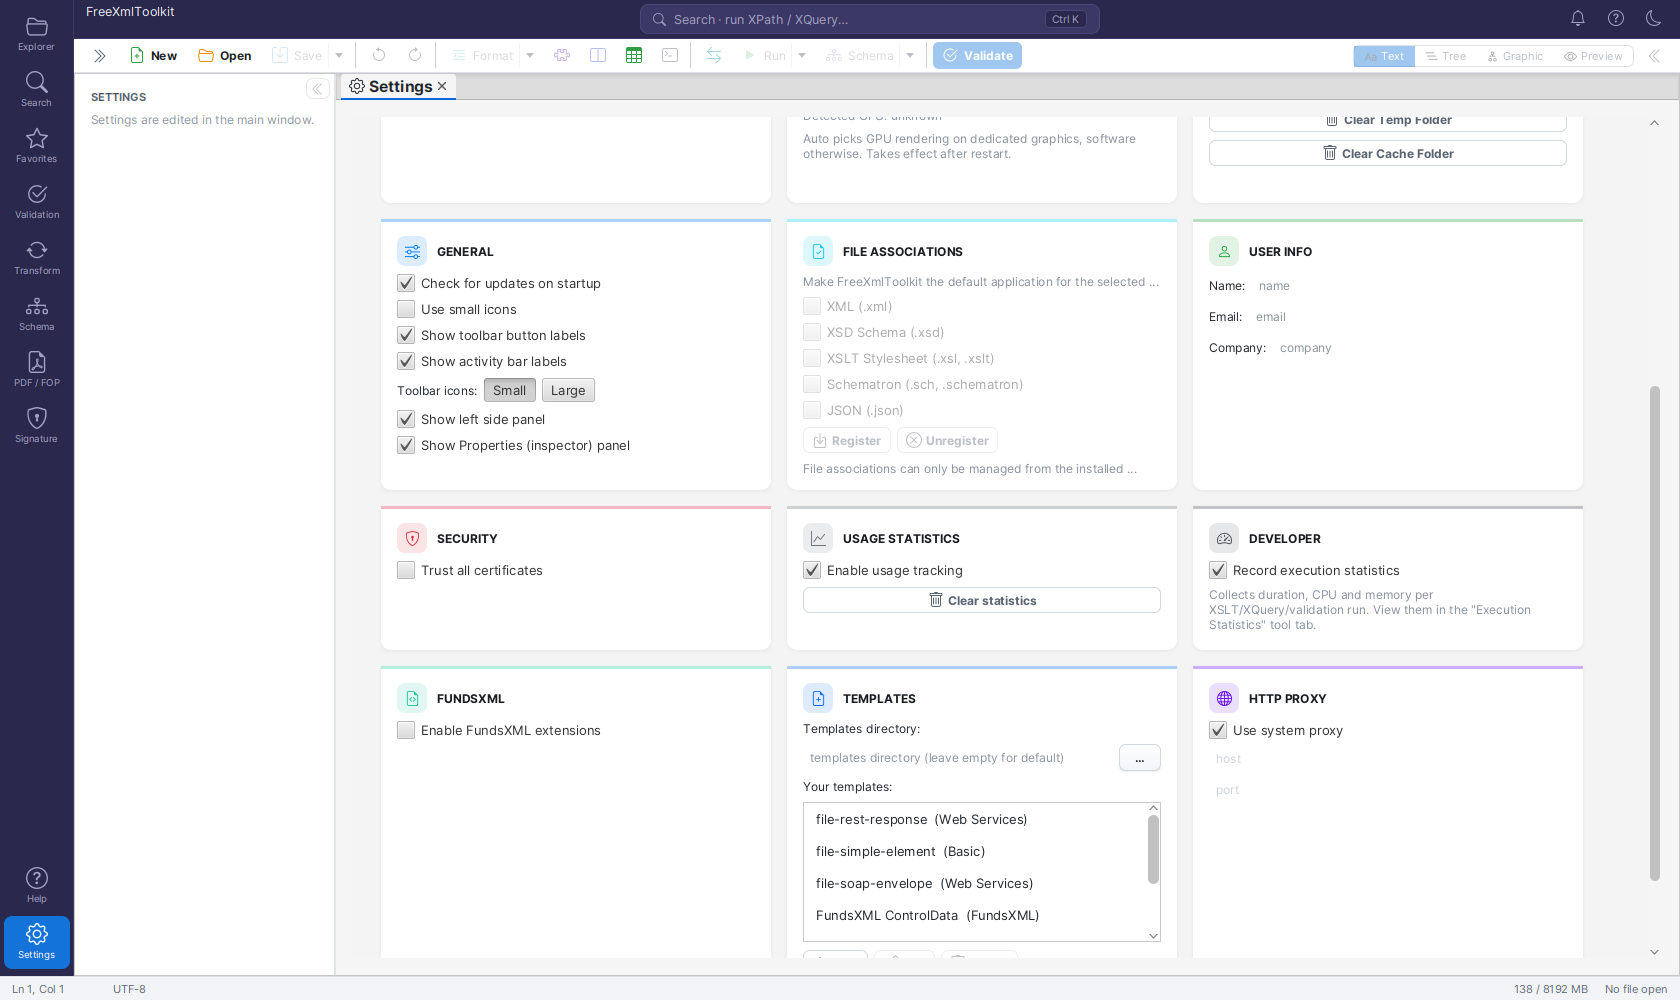
Open Settings → DEVELOPER and tick Record execution statistics. The flag is persisted; regular users who leave it off see no change anywhere in the UI and no measurements are taken (zero overhead).
Where the numbers appear
- Inline — panels append the run duration to their status lines: the OUTPUT
panel already shows
Transformed · 42 ms · 1234 chars; with the feature enabled the Query Console's RESULTS header, the Validation panel's status (Valid · 128 ms) and the PDF panel's success message gain the same information. - Status bar — a last run item (e.g.
XSLT · 42 ms) appears next to the memory meter. Click it to open the full history. - Execution Statistics tool tab — the complete history (last 200 runs): a table with time, operation, target, duration, CPU, memory delta, GC, sizes and status; selecting a row shows the detail report with the phase breakdown and throughput. Also reachable via the Transform panel's ⋮ menu.
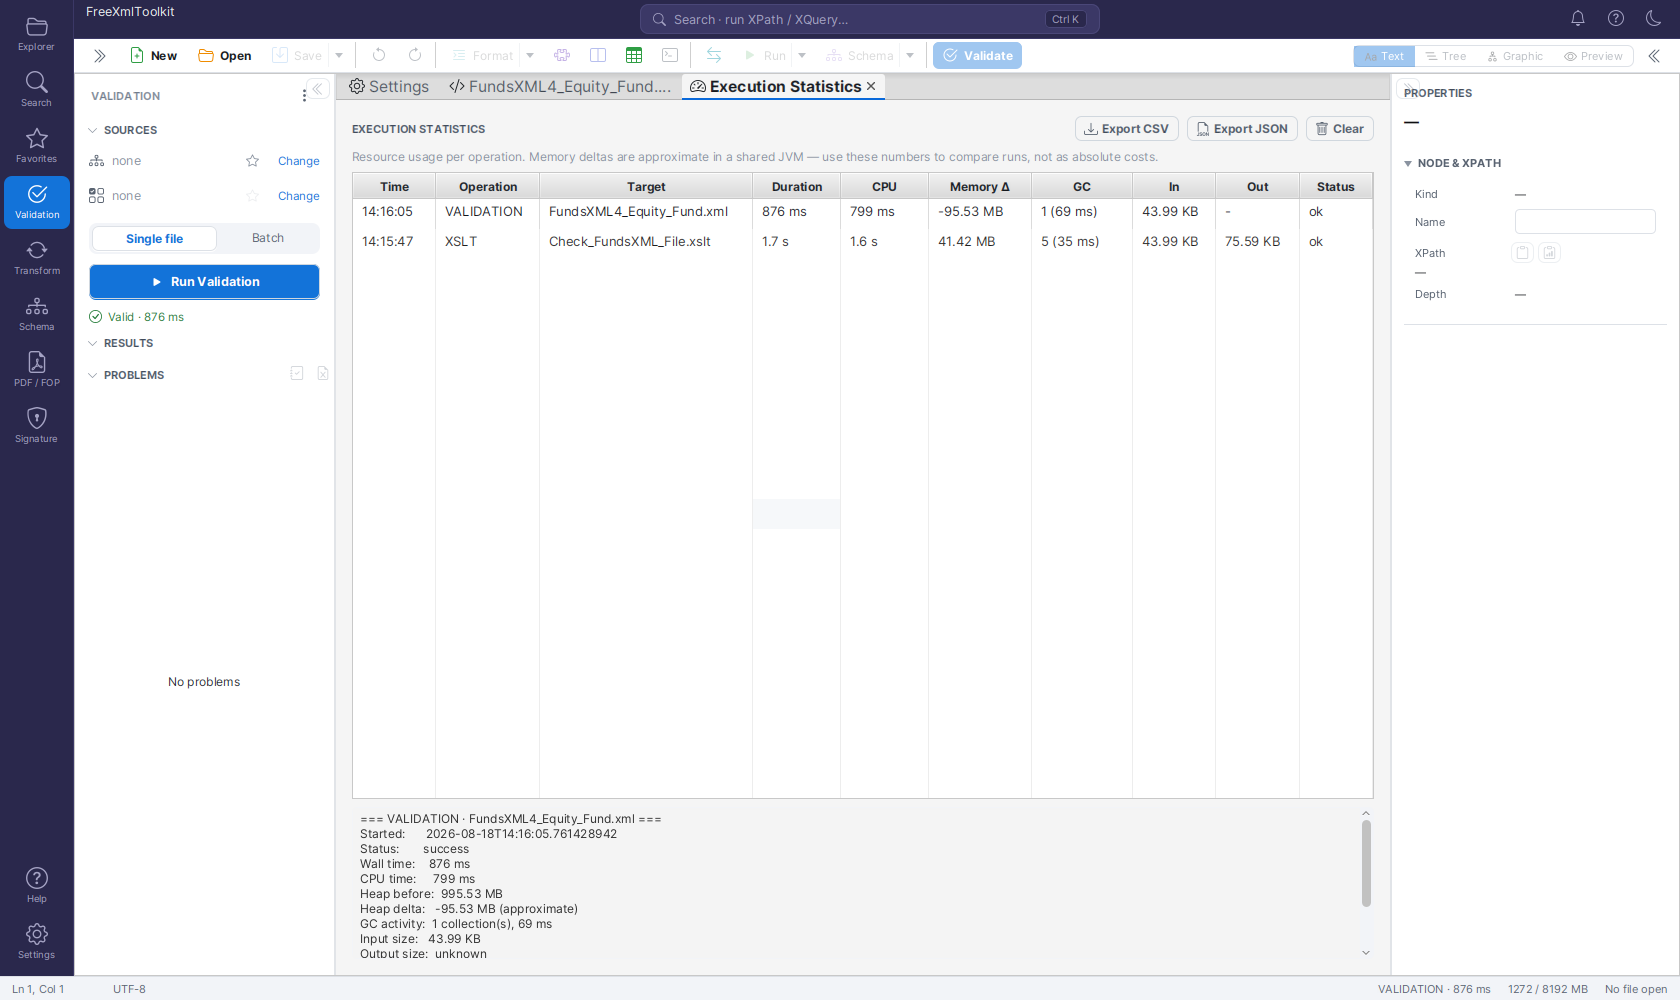
The screenshot shows two recorded runs: the validation of a FundsXML document (917 ms — also visible inline as Valid · 917 ms in the Validation panel and as VALIDATION · 917 ms in the status bar) and an XSLT check stylesheet (2.0 s, with its compile/transform phases in the detail report below the table).
Batch runs (multi-file transforms and batch validation) record one entry per file, so a mass run over a folder yields a per-file cost profile.
Export
The tool tab exports the recorded history as CSV or JSON — ready for a spreadsheet or your own analysis tooling when sizing server workloads or comparing script revisions.
Interpreting the numbers
- Memory deltas are approximate. All operations share one JVM heap, and a garbage collection during a run can even make the delta negative. Use the values to compare runs of the same kind, not as absolute costs.
- Compile 0 ms on an XSLT run means the compiled stylesheet came from the engine's cache — a server executing the stylesheet once per process will pay the compile cost on the first run only.
- CPU vs. wall time: a large gap usually indicates I/O or waiting, not computation.